Making WordPress Fast on Azure App Service Linux PHP 8

TL;DR:

To make WordPress fast on a vanilla Linux Web App, add app setting WEBSITES_ENABLE_APP_CACHE=true then redeploy your app, and ensure that you are not relying on filesystem (i.e. use Azure Blob or S3, deploy updates instead of live update plugins, etc)

App service on linux has been around for some time now, and as of PHP 8, it is now unsupported to run PHP on App Service on Windows. This blog was hosted on PHP 7.4 on Linux App Service and was very easy to manually deploy – I just created an app service (B1) and a MySQL Flexible Server (B1s), both on a basic tier, copied the files and DB over, and it cost only 60p per day = approx. £18 a month, well within my Visual Studio inclusive Azure credits, I was very happy… then I switched to PHP 8.

Firstly, be aware that once you change, you can’t go back! Then, be aware that they have changed from Apache to Nginx, so .htaccess file is not used any more. You will get 404 on any URLs not ending in .php. There is guidance on how to implement a rule in the nginx configuration to fix this here, using a custom startup script. Note you don’t need to create custom .sh file you can just put this into the Azure startup command:

cp /home/site/default /etc/nginx/sites-enabled/default; service nginx restart

I’m happy with this, the blog runs quick (TTFB = 0.4s). I like the simplicity of sticking as close as possible to vanilla PaaS service.

Which brings me to the main subject of this blog post. Another WordPress site I manage, this time a WooCommerce setup with 16 plugins. This site has been running fine on another platform but when we moved it into Azure App Service Linux the performance just turned abysmal – I’m talking just the time to return the homepage html document (TTFB) went up from about 0.8s to about 2.8s, and admin and shop pages even worse.

What I tried:

  1. Set app to Always On
  2. Scaling up the web app from S1 all the way to P1v3 made no difference
  3. Scaling up MySQL from B1ms to D2ads_v5 made no difference
  4. Check the metrics (CPU and Mem), nothing seems overloaded
  5. Setting FPM_MAX_CHILDREN=20 and some other settings after spotting a warning in the logs, made no difference
  6. Used Debug Bar plugin to check for slow MySQL queries and external HTTPS dependencies, but these were only taking about 200ms
  7. Enabling Redis Cache using the Redis Object Cache plugin, no difference
  8. Enabling WP-Optimize plugin, no difference unless I enable page level caching, which only benefits anonymous users.

Eventually I discovered that the bottleneck is disk I/O because App service runs the app from a network share. There are many discussions stating this is the cause, but not many with solutions.

This post hints at the PHP performance issues caused by disk IO and suggests you can use a custom container image, because then persistent storage is not used. This is probably another solution but I wanted to try and solve this while still running in vanilla web app, so not to have to maintain any docker images. The second option isn’t really viable, to make the app run from outside of /home. The third option is to use another hosting product! I was sure there must be an easier way to get the app running from local disk.

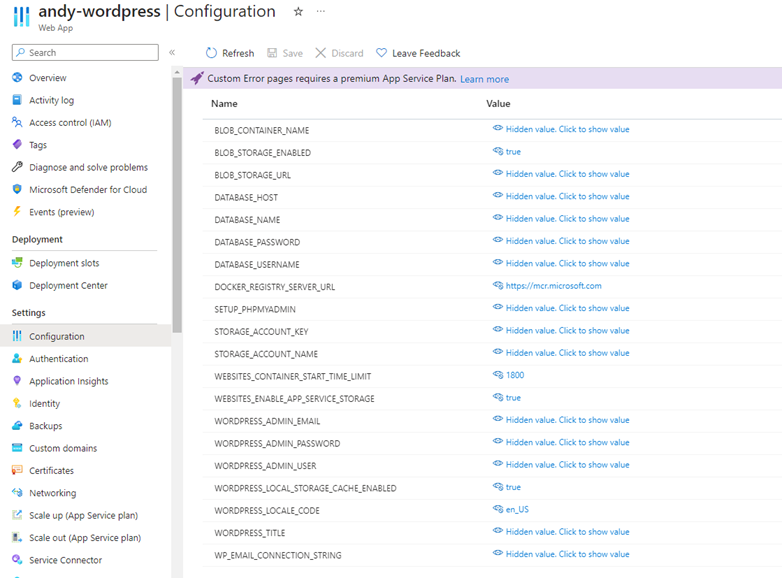
This post contains WordPress-specific app settings for Azure but I believe (some of) these only apply when using Microsoft’s WordPress marketplace template which uses a custom docker image (well, that aligns with the above post). Specifically, I had read that the appsetting WORDPRESS_LOCAL_STORAGE_CACHE_ENABLED = true would solve the performance issue, but it made no difference to my vanilla app. I span up a WordPress app via the portal to see how it is configured. Sure enough, it uses a container mcr.microsoft.com/appsvc/wordpress-alpine-php:8.2 and loads of the app settings referred to in the post.

Also I can see that they install W3 Total Cache and configure it to cache pages, using Redis Cache, and it uses Azure CDN. Fair enough, it is fast – under 300ms TTFB. This is all great, but I don’t want to add all this complexity into my existing app that hasn’t needed it before, I just want it to run as best it can without page caching. Anyway – half the shop can’t use this type of caching and none of the backoffice. I considered trying to use their image and deploy my WP into it, but decided to pursue more vanilla fix first (and there doesn’t seem to be much documentation for using it)… if you do decide to pursue this then the articles here would be useful.

This post validates that storage is slow on Linux web app, but the only suggestion is to mount premium SSD storage which is not supported for /home. Many people seem to have given up and hosted elsewhere, or are relying on caching plugins to improve performance to an acceptable level.

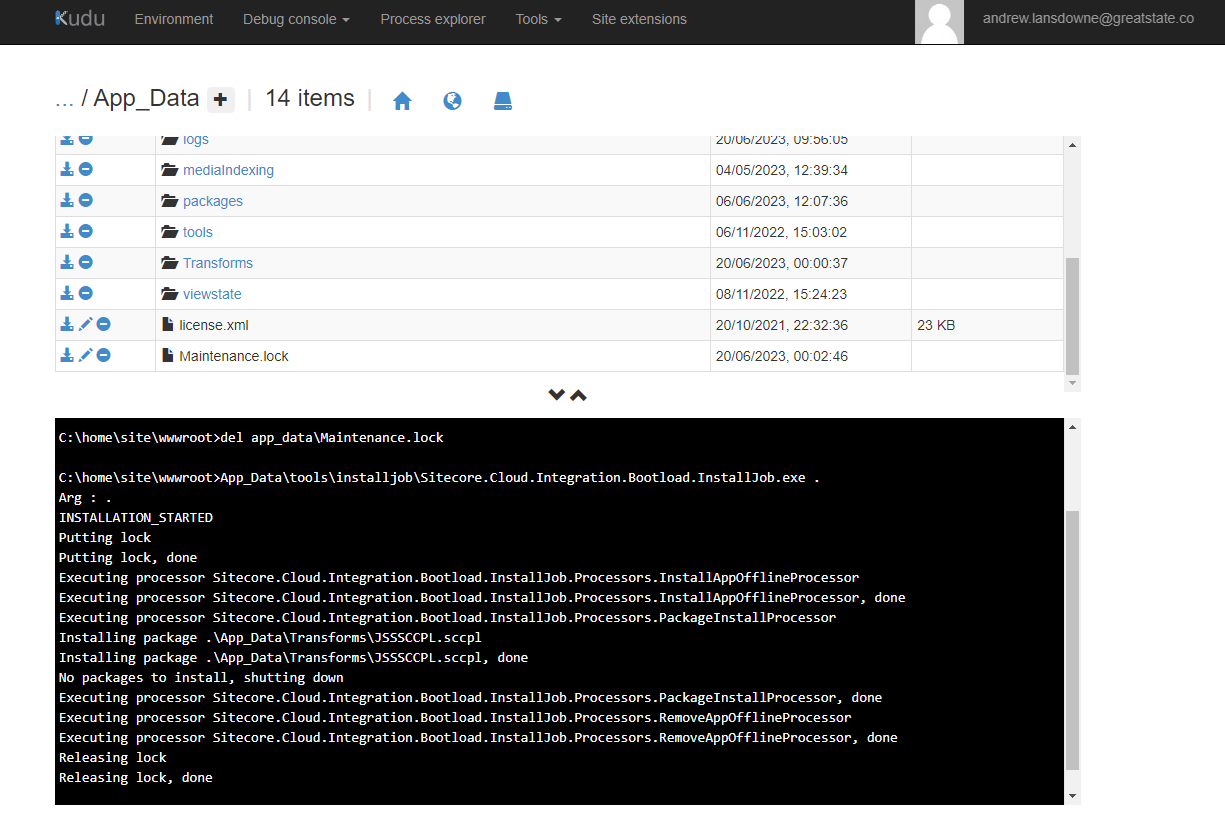
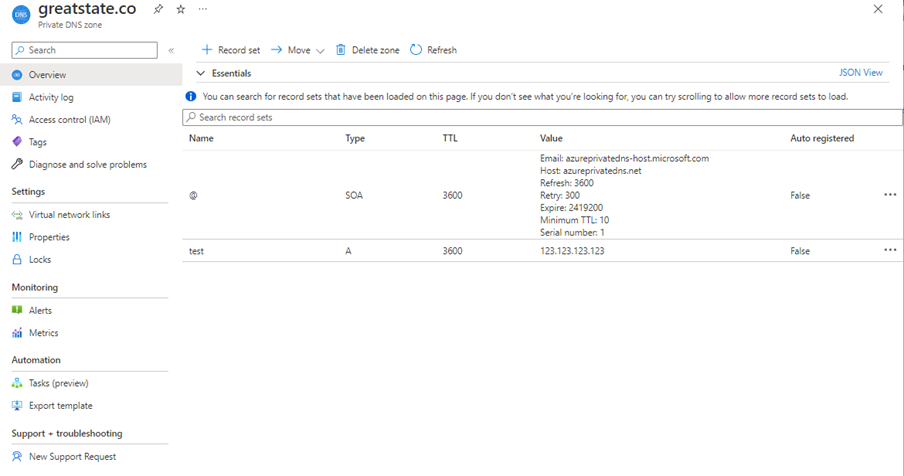
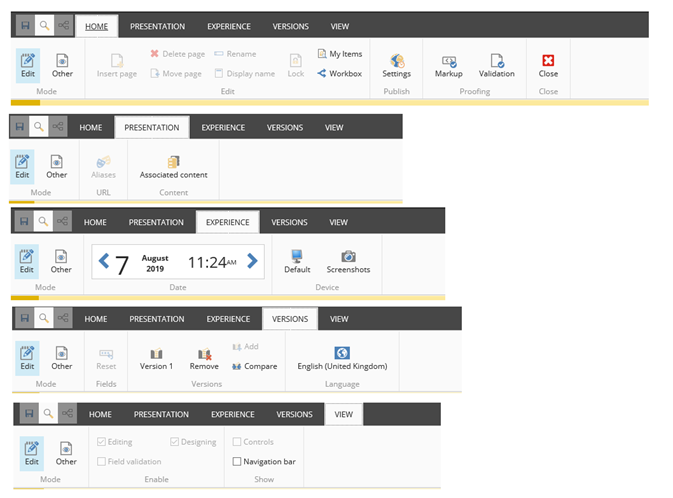
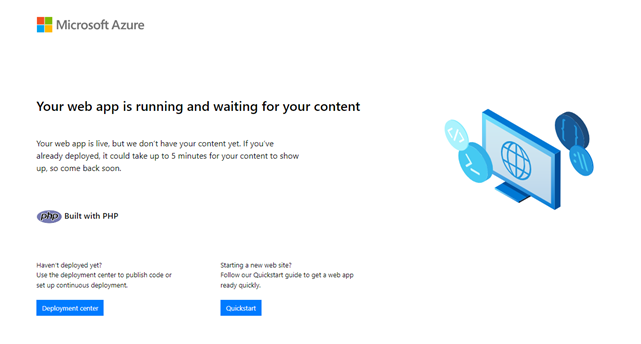
Finally I came across App Cache. Looks to be Linux equivalent of Local Cache. This post has been around since 2021 so I have no idea why it isn’t more popularised on the web. I tried it straight away – set WEBSITES_ENABLE_APP_CACHE=true. After enabling, my web app went back to the default state below, which was expected because it says you need to redeploy after changing the setting.

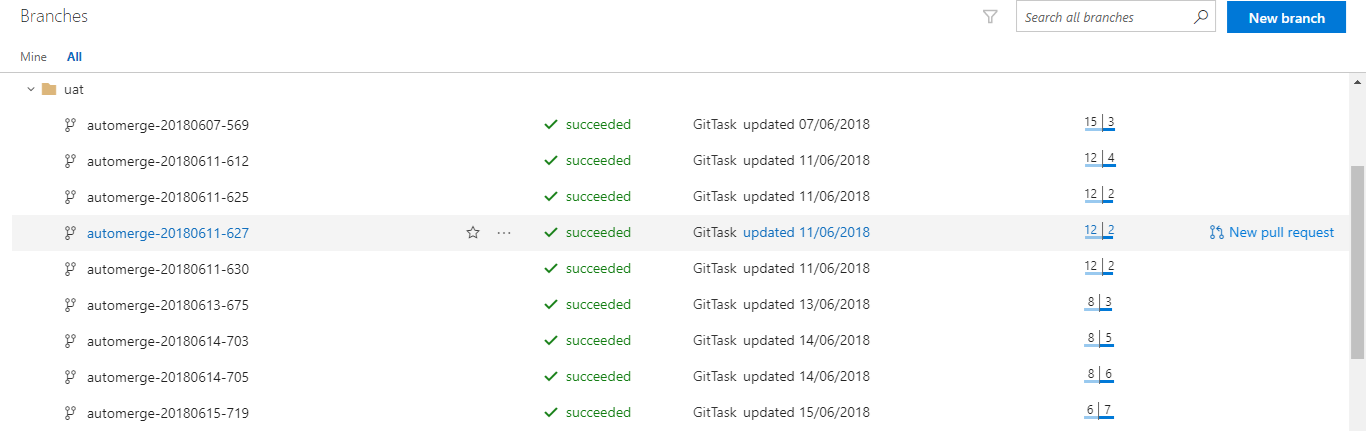
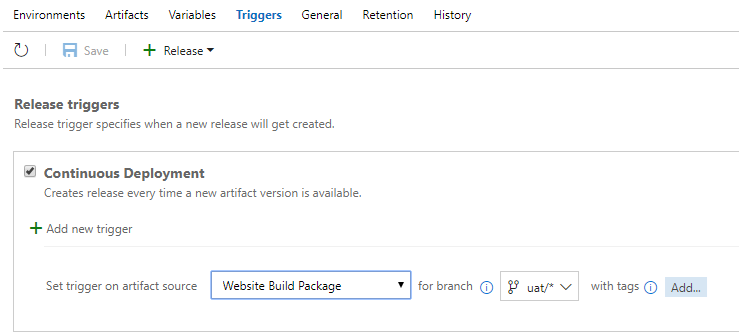
Then I redeployed the app (via Azure Devops – zip deploy) and it came back up as normal. Except – the homepage now returns in 500-600ms! This is even faster than it was on the previous hosting, and 4x faster than it was before adding the setting.

The only issue I’ve noticed so far, is that the nginx configuration I mentioned at the start of this post seems to have been lost. I will SSH in and investigate.

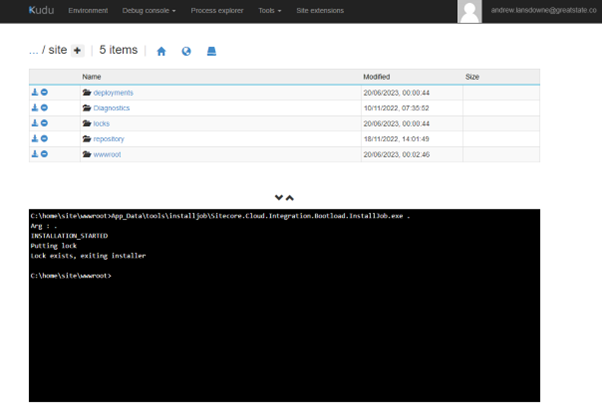
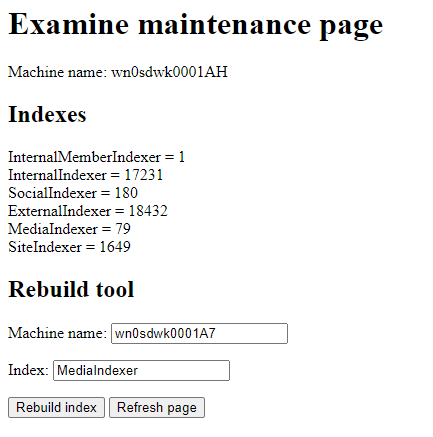
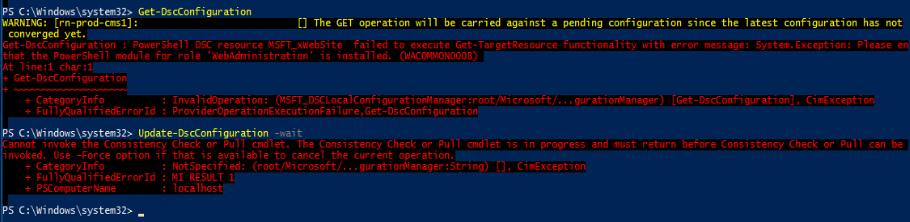
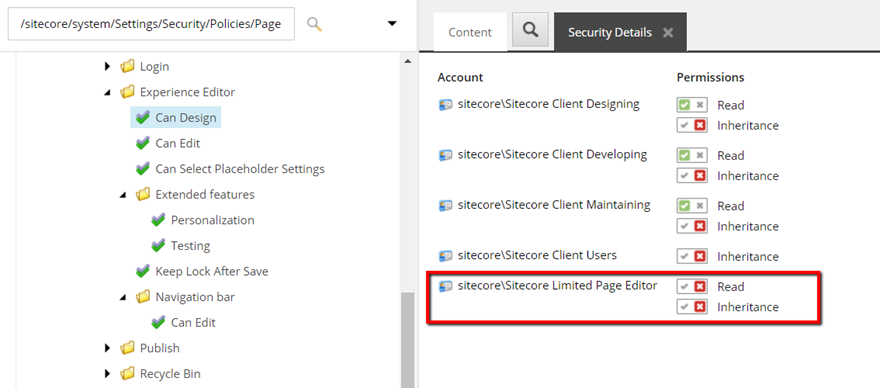
Turns out I now am logged into an “empty” instance with vanilla nginx config in /etc/sites-enabled/default and only the web files in /home and the site files are in /home/site/wwwroot:

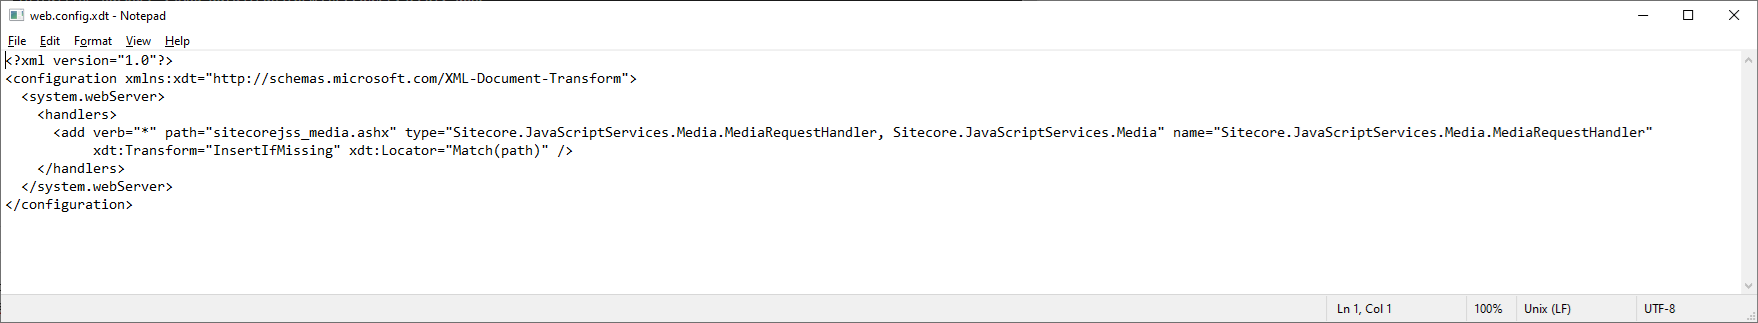
I added into location / { try_files $uri $uri/ /index.php?$args; } using nano and then ran service nginx restart and sure enough 404 issue is fixed. But I assume it will return on next deploy/restart. Sure enough, after a restart I am back to 404 errors.

It seems the Startup Command is not working when App Cache is enabled… this is rather an annoying problem, as this is so close to a solution. Then I found this great post about deploying Drupal using App Cache, from only last month! The trick is, to put your custom nginx default file inside the repo (the opposite to the usual approach!), so that it gets deployed into wwwroot within the container. I assume that means, my Startup Command was probably failing because the file didn’t exist at /home/site/default! Yep, it works, with startup command “cp /home/site/wwwroot/nginx-default /etc/nginx/sites-enabled/default; service nginx restart”

During my investigation I noted down these alternatives to investigate:

  • App Cache vs Run from Package – can the latter also solve this (if it even supports linux)?
  • Check if disk is really read-only with App Cache (as stated here) if so, does this cause errors? UPDATE – I don’t think it is read-only, as I am able to upload media successfully that is stored temporarily on disk.
  • App Cache caveat – you can’t rely on local storage so must avoid doing “live” plugin updates etc, and use Azure Blob Storage or S3 for media file storage.
  • Can we achieve this without App Cache by setting custom Site Root and startup script to copy the files out of /home?
  • Try setting WEBSITES_ENABLE_APP_SERVICE_STORAGE=false to force /home not to use shared storage.

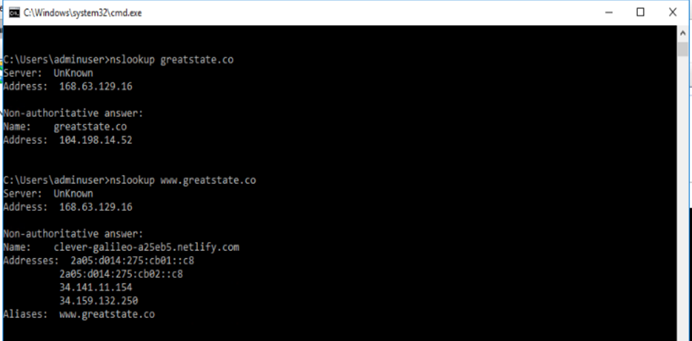
Strangely, that last setting also appears to work, without app cache. But, when trying to replicate this on another environment I could not get the performance improvement unless I enabled and then disabled App Cache! I think there is something strange going on. When I diff the environment variables the only difference is APPSVC_RUN_ZIP goes to ‘true’ once you do this. So I think this is doing something behind the scenes which also makes it fast (sounds a bit like ‘run from package’ doesn’t it…) although I can’t find any documentation about this.

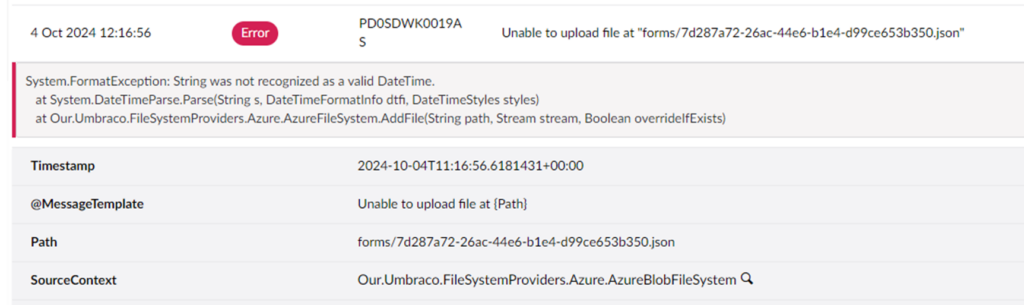
While testing this setup I found I could no longer upload media files and got an error that the disk is read only “Unable to create directory wp-content/uploads/2023/11. Is its parent directory writable by the server?” so I think it is a non-starter anyway, given that App Cache is at least mostly documented I will use that approach.

Investigating Sitecore 10.2 XP on Azure PaaS Updating screen

After a normal, successful, code deployment to a Sitecore 10.2 XP site hosted in Sitecore Managed Cloud (PaaS – App Services) we found this screen on the CM instance “Stay tuned we are updating…”

After searching for this I found some helpful posts including https://www.asmagin.com/posts/2019/01/stuck-on-stay-tuned-page-after-scwdp-package-deployment/ but as this is so peculiar I wanted to keep notes of my own investigation into the reason for this screen, which seems to be caused by an AppOffline.htm file in my site folder… but why is it there?

First I went to scm and attempted to manually run the bootloader as per the above blog, which sure enough exists in the app_data\tools\installjob folder (must be part of Sitecore Managed Cloud 10.2 deploy as we haven’t put it there).

Looks like there is a file App_Data\Maintenance.lock , so I deleted that and then retry:


Well it seemed to work this time and the site came back up. So that is a bit of a mystery.

Later on I found “InstallJob.log” files in /home/LogFiles (thanks to pointers in \App_Data\tools\InstallJob\Sitecore.Cloud.Integration.Bootload.InstallJob.exe.config)

Sure enough seems like there was an aborted installation job yesterday that installed the AppOffline file even though according to the log it was supposed to be “exiting installer”

Then the log from this morning shows it failed to run a few times but did nothing until 9:12 which was when I deleted the Maintenance.lock file and re-ran it manually.


Digging deeper into what this all is:

In our case we have Sitecore Headless Services 20.0.2 installed and to ensure the correct files are deployed to each environment I am deploying the files from the “Sitecore Headless Services Server XP 20.0.2 rev. 00545.scwdp.zip” file , which turns out to include the JSSSCCLP.sccpl file inside App_Data\Transforms. This is a zip file as described in https://doc.sitecore.com/xp/en/developers/sat/28/sitecore-azure-toolkit/the-structure-of-an-sccpl-transformation.html

This particular zip contains one web.config XDT transform which is to add the jss media handler:

The docs mention bootloader in relation to ARM templates (which we aren’t using since the deployment was done by Sitecore Managed Cloud) but don’t mention any detail about how it processes files on app startup https://doc.sitecore.com/xp/en/developers/sat/28/sitecore-azure-toolkit/configure-the-bootloader-module-for-a-sitecore-deployment.html

I assume that the installjob.exe runs automatically on app start and processes all the files found somehow.

I found the file that actions this (?) as mentioned in another blog post in \App_Config\Sitecore\Azure\Sitecore.Cloud.Integration.Bootload.PostStepsRunner.config

Still not clear how this all ties together.. then I found this helpful post https://kezhan.info/2018/02/26/All-about-SitecoreCloudIntegrationBootload although that is for Sitecore 8 but it sounds like much the same today.

So it sounds like Sitecore Managed Cloud deploy the Bootloader WDP from Sitecore Azure Toolkit into all Sitecore Managed Cloud sites, and this in turn monitors \App_Data\Transforms and installs any package found in there…

OneTrust / CookiePro script replacement type=module

OneTrust and CookiePro are two versions of the same cookie consent product from OneTrust. We use one of these tools on many websites to allow users to consent to cookies, there is a control panel where you can configure the UI etc and it is fairly unobtrusive compared to some cookie consent products.

Typically once you have configured and added the cookie consent banner to your site, it won’t actually stop cookies (especially 3rd party ones) unless you configure your site not to load 3rd party scripts until the requisite cookie category consent has ben provided by the user.

There is a load of documentation on ways to do this.

The simplest, for 3rd party script tags, being the JavaScript Type Re—Writing. Instead of

<script>

or

<script type="text/javascript">

you change this to, for example,

<script type="text/plain" class="optanon-category-C0002">

and OneTrust will automatically load the script after the user accepts cookies for the category specified (C0002 = performance category) both on 1st and subsequent page loads.

However, what if your 3rd party script was a module i.e.

<script type="module">

I could not find any documented means to get OneTrust to load the script with the correct type=module, so had to improvise with this script instead:

 <script type="text/plain" class="optanon-category-3">
    const myscript = document.createElement('script');
    myscript.src = 'https://3rdparty.domain.com/my-app.js';
    myscript.type = 'module';
    document.body.appendChild(myscript);
</script>

This seems to work perfectly well and better than other hacky workarounds I tried such as loading the script in the OptanonWrapper function or using the OneTrust.InsertScript or OneTrust.InsertHTML helper methods.

Azure Private DNS will break your network if used incorrectly

I am not a networking expert but in configuring some Azure cloud services I came across the need to use Azure Private DNS to create a private DNS zone for an App Service Environment v3 (Isolated web app that sits within a vnet).

This is something that is needed to be able to connect to the web apps that are hosted in the ASE from elsewhere in the virtual network (e.g. other web apps in the ASE), without needing hosts file entries (which are impossible to create on PaaS services).

Then I realised that my web app also needs to connect to other existing web apps which are hosted internally. These apps have been setup on Windows VMs using IIS with the proper HTTPS binding with their proper URL (public traffic is routed via an Application Gateway). In this particular restricted environment, outgoing internet HTTP/HTTPS requests are restricted to pre-approved domains. Hence on existing VMs we have some hosts entries so that they can access each other via their internal IPs.

My plan was: Create an Azure Private DNS zone and then create A records matching the app URLs with the internal IP of each app.

However, it turns out that once you create a Private DNS Zone, all public records beneath this are no longer accessible from resources within your vnet. You would have to duplicate all the public DNS records to be able to have a private DNS zone for a top level domain.

I did read about Split Horizon / Split Brain DNS and I was hoping that if a DNS entry isn’t resolved by the Private Zone then it gets recursively resolved by Public DNS but it isn’t the case. I believe you could to use Azure DNS Private Resolver to do this, which is much cleverer, but a much bigger thing to add to a vnet.

Here’s an example.

From a VM in the vnet in question I can do some DNS queries for my company’s public domain:

Then, in the Azure Portal (in an account / subscription that has nothing to do with Great State, but has a virtual network and VMs already) I can create a Private DNS zone for greatstate.co – just like the documentation about Split-Horizon functionality suggests doing for contoso.com :

I have added a test.greatstate.co DNS record so I can be sure it is working.

I then link this up to my vnet from the Virtual network links tab.

Then go back to my VM, flush the DNS and I can query the test.greatstate.co DNS record. Unfortunately, I can no longer query greatstate.co or www.greatstate.co so I have totally broken DNS for the entire domain within the entire virtual network!

This is such a dangerous thing that I’m surprised there isn’t a warning in the docs or in the Azure Portal in the creation of a Private DNS zone.

This page does suggest that it can have consequences since Microsoft have blocked their own domains being used as Private DNS zones!

How to check and rebuild Examine indexes on each node of an Umbraco Azure Autoscaled web app

If you run your Umbraco 7+ on Azure, and you have split out CM and CD so that /umbraco is not accessible on the CD site (i.e. www) then you may have wondered how to rebuild the Examine indexes if you ever had to. Or even how to check the status.

Of course you could enable Umbraco access on CD but this is not ideal, as it exposes the Umbraco admin interface to the world. Even if you do this temporarily and then change it back there is a risk that you forget and/or break the website in doing so. You could enable it just from your IP address.

Even if you do this, when you go to the Developer > Examine Indexes tab, if your app is scaled up 2+ instances then each time you refresh it will go to a different server and be difficult to tell which server(s) indexes you are looking at / rebuilding.

To help with this I made a quick script that can be dropped into an Umbraco 7 site.

The only thing you also have to do is to add its URL into the umbracoReservedUrls setting in web.config.

It is very basic and ugly, but it shows you the important information – – which server you are looking at, and the state of the indexes (how many documents).

You can compare this against the expected state of each index from the CMS (where you can reliably rebuilt the indexes through the backoffice first to ensure they are complete).

If any index is incomplete on one or more nodes, the tool lets you rebuild it by specifying the machine and index name and then press Rebuild. In case the next request goes to one of the other nodes, there is a warning and you can click Rebuild again until your request goes to the correct node. Then just refresh a few times until you see that the index count on the given node is what you expect.

This simple tool allowed me to rebuild a corrupt index and more importantly be confident that the index state on all the active nodes is the same and complete.

The code can be found here, just save the .aspx file into the website (add it to umbracoReservedUrls if needed).

Have only tested this on v7.6.4 (and I know, I need to upgrade, which will probably solve the indexing problems!) it should at least work on newer v7 and possibly newer versions.

Reboot Node if Needed in Azure Automation State configuration (DSC)

In Azure Automation when onboarding a server you have a choice whether to “Reboot Node if Needed” which many tutorials will suggest you should tick.

However you might wonder what about production servers, do you really want them to reboot themselves?

Of course you could initially onboard a server with the Reboot ticked if needed for initial setup and then re-onboard it with it unticked so that once in production it doesn’t get rebooted. But what if you forgot to change it? For this reason I’d rather onboard Prod servers without automatic reboot.

So I wondered, what actually is the experience if you don’t tick the box but the node requires reboot? Is it still possible to apply configurations that require reboot but manually rebooting? How would you know when the reboot is required?

What I found was the node gets “stuck” in “In progress” state:

If I click into the node then (after some time has passed) I see that no status is shown even though reports are coming through (normally these would show Compliant or Failed):

If I click on either of these then it says:

So there are no failures logged it just is unable to state if the configuration is fully applied or not.

On the server I tried to interrogate the DSC status:

It isn’t totally clear that the node requires rebooting. But if you are aware that this is the reason the configuration “has not converged yet” then it is easy enough to manually reboot the node.

After reboot, the node goes to (in my case) Failed or Compliant like usual.

So it is fine to not allow reboot keep in mind that the node will show In Progress indefinitely until rebooted if this is required by the configuration. At least this is the case with my example that is waiting for WebAdministration role to be installed

Poor man’s approach for diffing your Sitecore 9 database

During an upgrade we needed to compare the core database with the out of the box one to confirm what changes had been made, in case they hadn’t been checked in with Unicorn.

There is a great tool called Razl that I recommend you look at. It used to provide a free trial but not any longer.

As we only wanted to do a quick diff I tried an alternative approach, using the built-in serialisation tools.

  1. Set up a Sitecore instance using the target database
  2. Log into Sitecore as admin
  3. Right click the content editor ribbon and enable Developer
  4. Choose the portion of the tree that you want to diff, click Serialize Tree
  5. Download the contents of the App_Data/Serialization folder (or just the sub folder that represents the part of the tree you are interested in) it might help to clear out the Serialization folder if you aren’t using it and want to just compare it wholesale
  6. Run through steps 1 – 5 using a Sitecore instance pointed at the source version of the database you want to diff (for example, the vanilla Sitecore database for your Sitecore version)
  7. Use a tool such as WinMerge to compare the two folders, and hide the identical items. It is actually quite easy to navigate and diff to see the changes that have been made.
  8. Diff any files that represent items to see what has been changed. If still unclear, use Sitecore to load up the item in question and see the changes in the content editor.

Happy diffing!

Speeding up Sitecore 9.1.1 Experience Editor with Limited Page Editor role

After an upgrade from Sitecore 9.0 to 9.1.1 we found that the Experience Editor load time had gone from 8 seconds to over a minute! The time is all spend loading Ribbon.aspx.

Sitecore have been unable so far to determine the cause of the slowdown, but various posts imply that other people have the same issue either on new or upgraded 9.1 sites, and that a good way to speed this up is to tweak the page editor ribbon options.

I spend some time looking at the built-in roles that might help.

I found that any user that inherits from sitecore\Author is extremely slow (~70 seconds). The tabs include “Optimization” which is not even needed by our site which has xDB Disabled!

It looks like this is due to sitecore\Author inheriting from Analytics roles:

  • sitecore\Author
    • sitecore\Analytics Testing
    • sitecore\Analytics Personalization
    • sitecore\Sitecore Client Authoring

If I use sitecore\Sitecore Client Authoring instead then the load time goes down to 40 seconds and it no longer includes the Optimization tab.

This implies that the Optimization tab was adding about 30 seconds. But 40 seconds is still too slow.

I found that by adding the role sitecore\Sitecore Limited Page Editor in addition to either of the above roles then it loads in 15 seconds but only the ribbon contains 2 tabs – Home and Versions. However the tick boxes on the View tab are present on the Home tab.

The only issue here is that the Add Component button is greyed out. I found that this is due to it being Denied read access in the item in the core database – /sitecore/system/Settings/Security/Policies/Page Editor/Can Design

Once I removed this, the design features are available and the experience editor appears perfectly usable, and much faster.

If / when we find a better way to resolve this without limiting the features, I will update this post!

Multiple Workstreams Git Branching Strategy and VSTS Build/Release

After moving from Subversion to Git we struggled to adapt our old branching strategy, which was to do all work in trunk and then cherry pick bunches of commits into a release branch for QA/deployment. Git prefers to merge whole branches at a time, while cherry pick is supported it results in a different commit being made in the target branch and gets messy very quickly.

For most projects we just moved to a more sprint-based approach using gitflow or gitlab flow, did work in feature branches, pull request into master when dev complete, then master is deployed to test site, when a sprint worth of work is complete, either deploy straight from master or a release branch.

However, a few projects didn’t suit this because we always have a number of workstreams on the go at the same time: a few may need to be deployed to test together, but then end up going live one at a time in another order. Feature flags and automated tests are great but sometimes bad code just gets into master, and having this go live would be a nightmare. I concluded:

  • Work must remain in feature branch until it is GO LIVE READY:
    • Code reviewed by another dev
    • Automated tests pass
    • Manual QA pass
    • Approved by product owner

So we can set branch policy on master to require a few people to approve, and a working pull request build which runs unit tests. With that in mind we now have master is basically live, and feature branches in various states. How to test them?

  • Deploy one branch at a time to test site. Impractical if multiple workstreams need to be visible at once.
  • Set up an environment for each branch ready to test. A lot of effort and potentially cost.
  • Merge the “ready” branches into a copy of master then deploy this to the test site.

Option 3 was the only option for some projects. But the thought of maintaining a ‘qa’ branch by manually merging the correct features into it sounds terrible. So we automated it.

In VSTS we have a Build that is manually triggered, it checks out the latest master branch then runs this powershell:

git fetch origin
git reset
git config --global user.name GitTask
git config --global user.email [email protected]
git checkout -b uat/$(Build.BuildNumber)
git merge --no-ff $(branches)
if ($LastExitCode -ne 0) {
  throw "Merge Failed"
}
git push --set-upstream origin uat/$(Build.BuildNumber)

There is a build variable which lists the branches ready to be tested e.g. “origin/feature/123 origin/feature/245 origin/bugfix/123”. This is manually edited when a new branch needs to be included for test, then a build queued. This is doing an ‘octopus merge’ i.e. merging multiple branches into one.

It checks this into a branch named based on the build number e.g. uat/{date}-{count} or whatever you like. This is so you can manually interrogate the result of the merge (and what has been deployed) and also to split the merge from the actual build. To enable the script to “git push” I had to edit the repository security and enable ‘Create branch’ and ‘Contribute’ permission for the ‘Project Collection Build Service’.

Then there is a normal Build which compiles the code and generates an artefact (web deploy package in our case) which is set to trigger on uat/* as well as master (the same build generates the artefact from master branch which is deployed to live).

Then we have a Release which picks up this build (also filtered on branch uat/*) and deploys it to the QA site.

So if a developer updates any of the branches in QA they only have to queue the automerge build.

Once a particular change is approved and the pull request closed, this triggers the build from master, which triggers the start of a deployment pipeline to deploy to staging and then live (with manual approval steps).

This has worked pretty well so far, and solved the problem of multiple workstreams for us. I would only suggest something like this if you have tried to work in a normal git branching strategy and it isn’t working out. As it could come back and bit us if we let the feature branches get too large, the merge might continually fail, or we might get lazy at closing pull requests, etc. But I thought I’d share in case this helps anyone with a similar issue.

Add Page Views column to the table on Sitecore Analytics Reports

On many pages of the Sitecore Analytics dashboard, there is a table of visit data.

This by default is sorted by page views descending, but there is no page views column! The Visits column is actually the number of visits where at least one page view hit the page in question.

We were asked to add Page Views to this table, and it turned out to be incredibly easy.

In the Core database, go to /Sitecore/client/Applications/ExperienceAnalytics/Common/System/ListControl and you’ll see all the headings from the above table are items under this one:


Simply duplicate the Visits item and change the header to “Page views” and data field to “pageViews” as per the above screenshot.

Hey presto:

Also worth pointing out you can set the default sort option here under the relevant ExperienceAnalyticsListControl Parameters item (see my previous post for more detail on customising the Analytics pages):